In 1960, a Science Paper Calculated the World Would End on November 13, 2026

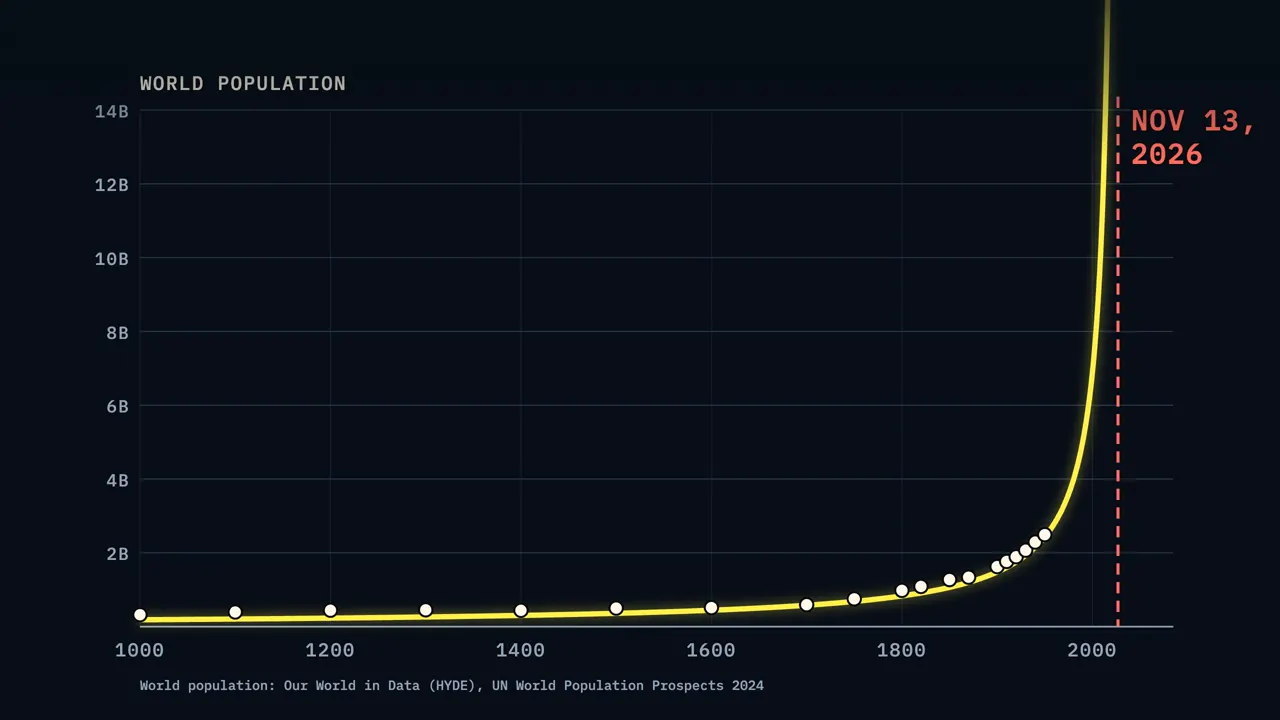
In 1960, three researchers at the University of Illinois, Heinz von Foerster, Patricia Mora and Lawrence Amiot, published a paper in Science titled "Doomsday: Friday, 13 November, A.D. 2026". They fitted 24 estimates of world population to a curve that reaches infinity on that date. The world did not end, but the usual story is wrong too: the real population stayed above their curve until 1993. The curve bent when the global growth rate peaked in 1963 and then fell as birth rates declined around the world. Today, the global fertility rate is close to the "little more than two children" the authors prescribed, and about two thirds of humanity lives in countries where fertility is below 2.1 births per woman.
This article is the full narration of the video. Watch on YouTube
Friday, November 13, 2026: the 1960 doomsday paper
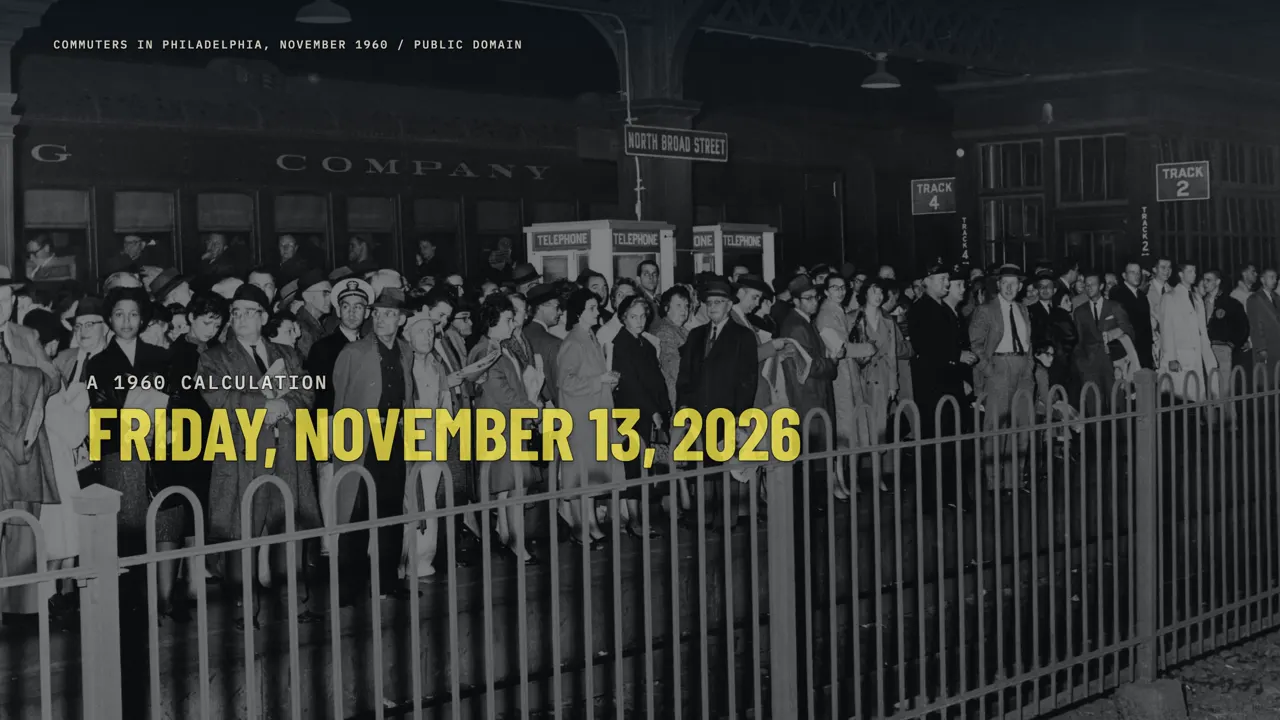
In 1960, scientists calculated that the world would end on Friday, November 13, 2026. Not from a prophecy, and not from an asteroid. From a curve. Heinz von Foerster and two colleagues at the University of Illinois took 24 estimates of world population,
reaching back about two thousand years, and found one formula that fit nearly all of them. Run that formula forward, and the number of people on Earth doesn't just keep growing. It shoots up to infinity, and the date it gets there is this November. They published it in the journal Science, under the title "Doomsday: Friday, 13 November, A.D. 2026."
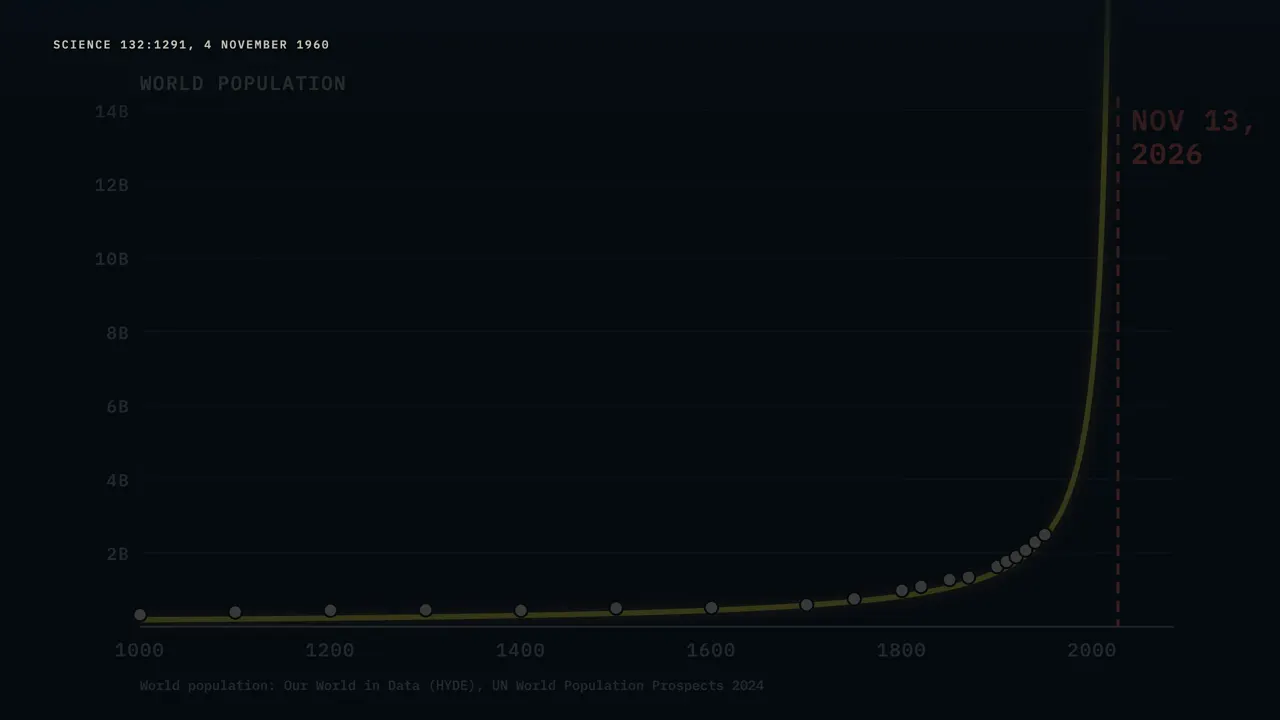
We're obviously still here, and there are about eight billion of us, not infinitely many. But the usual story, that the curve fell apart right away, is wrong. For more than thirty years after it came out, humanity was actually running ahead of the curve. What finally pulled us off it is the same thing behind the falling birth rates that so many countries now worry about.
A curve that hits infinity

A familiar way for things to grow is exponentially, at least for a while. Bacteria in a dish, or money earning a fixed interest rate: each step adds the same percentage of whatever is already there. Exponential growth gets enormous, but it never reaches infinity on any particular date. Von Foerster's formula is different.
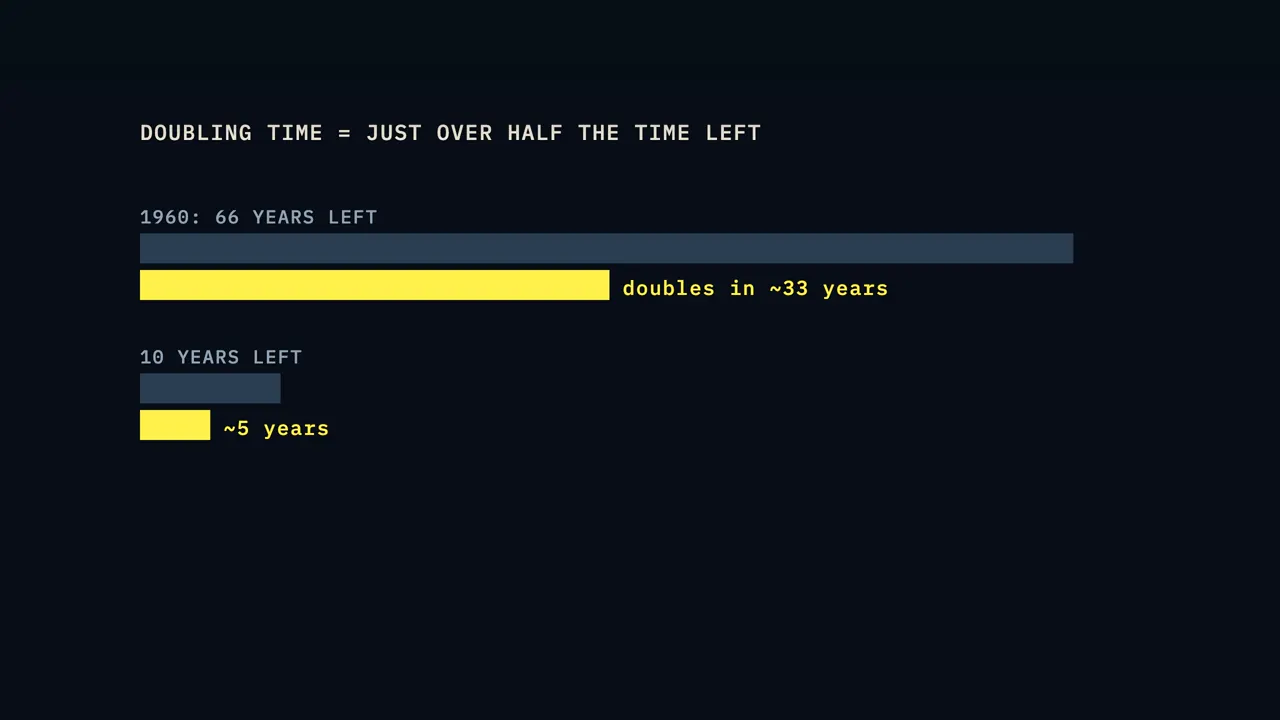
It's hyperbolic: roughly, the population equals a constant divided by the time left until one specific date. As that date gets closer, the time left shrinks toward zero, and the population blows up. Mathematicians call that a finite-time singularity. Work out the doubling time from the formula, and it's always just over half the time that's left.
So in 1960, with 66 years to go, the formula expected the population to double in about 33 years. Ten years before doomsday, it would double in about five years. One year before, in about six months. Fitting their 24 estimates gave the authors three numbers.
A constant of 179 billion, an exponent of 0.99, which is almost exactly one, and a doomsday date of 2026.87, give or take five and a half years. The authors reported a typical fitting error of about 7 percent. As a calendar date, 2026.87 lands in mid-November. Friday, November 13 falls right in that window, and biographies give von Foerster's birthday as November 13, 1911.
We found no statement from him saying whether that was a joke. And the fitted date came with an uncertainty of five and a half years either way, so November 13 was never an exact deadline.
Why more people would grow faster

Here's the strange part. In nature, crowding usually slows growth down. Put fruit flies in a milk bottle and they multiply fast at first, then level off as food and space run out. The paper uses that very example.
Ecologists call this logistic growth, the natural starting point for thinking about population limits. Von Foerster's team argued the opposite. Unlike flies, people talk to each other. They form what the paper calls coalitions, and a big enough coalition can act like a single player in a game against nature.
So instead of slowing growth down, more people would speed it up. Mathematically, that's all it takes: if the growth rate per person rises in proportion to the population, you get a curve that reaches infinity in a finite time. In 1993, the economist Michael Kremer built an economic model with the same shape.
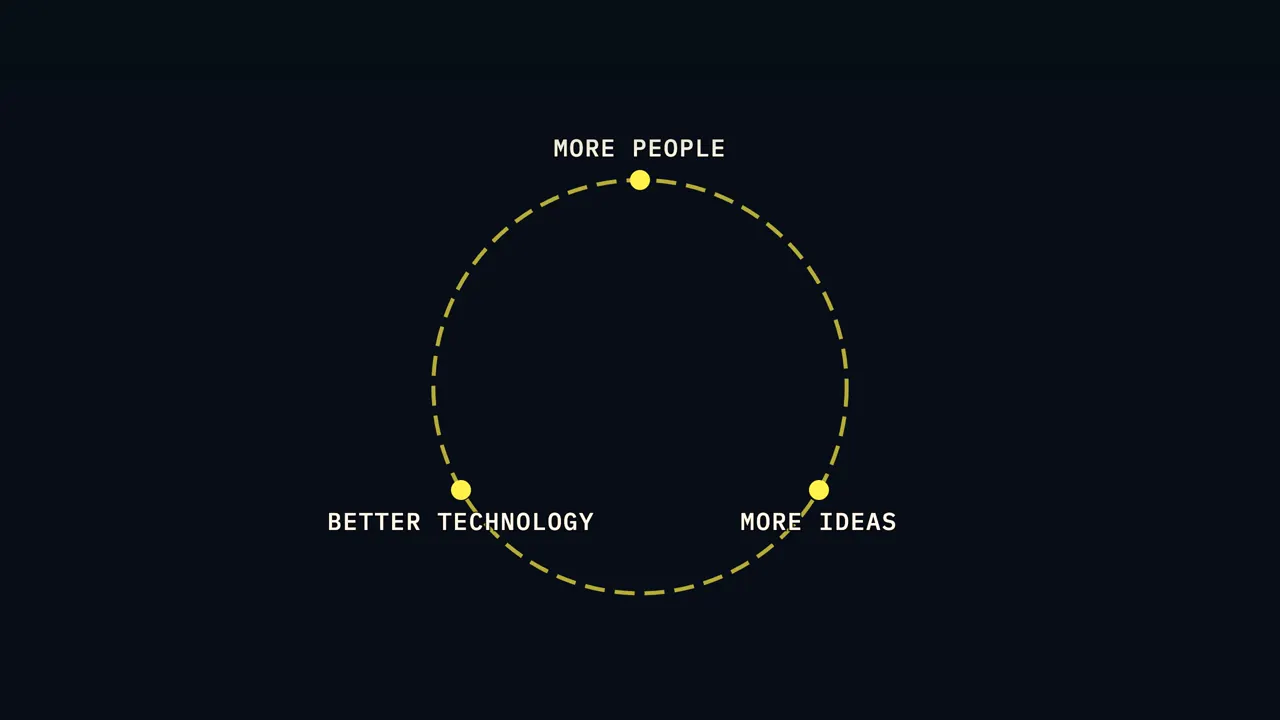
His model centers on invention. An idea, like a better plow or a vaccine, can be used by everyone at once without being used up. So more people means more inventors, technology improves faster, and better technology lets the land support even more people. That loop is what makes growth hyperbolic.
Kremer looked for a test at the end of the last ice age. As the seas rose, they separated regions that then had very little contact for thousands of years. Comparing those regions around the year 1500, Kremer found that the bigger the region, the more advanced its technology tended to be. The smallest pieces are the most striking.
Tasmania, cut off from mainland Australia, had a small population, and according to the archaeology Kremer cites, it actually lost the ability to make bone tools. On tiny Flinders Island, the people disappeared roughly four thousand years after the sea cut them off. A small, isolated group didn't just grow slowly.
It could lose what it knew. Von Foerster's team weren't the only ones who saw the acceleration. That same fall, the ecologist Edward Deevey published a graph of human numbers over a million years in Scientific American, and back in 1947, François Meyer in France had already argued that history itself was speeding up.
Joke or warning?

So who were these people? The paper lists all three authors in the Department of Electrical Engineering at the University of Illinois. They came at population from electrical engineering, not demography. Biographies describe von Foerster as a physicist from Vienna.
He edited the records of the Macy conferences, the postwar meetings where cybernetics, the study of feedback and control, took shape, and in 1958 he founded the Biological Computer Laboratory in Illinois. That background shows in the paper, and so does his sense of humor. The authors work out that Charlemagne, if he'd had their formula, could have predicted doomsday
to within 300 years, Napoleon to within 30, and people in 1960 to within about ten. Run the curve backward, and the population drops to a single person, Adam, about 200 billion years ago, far older than anyone thought the universe was. They also brush off escaping into space, noting that nobody could issue those travelers a permit to come back to Earth.
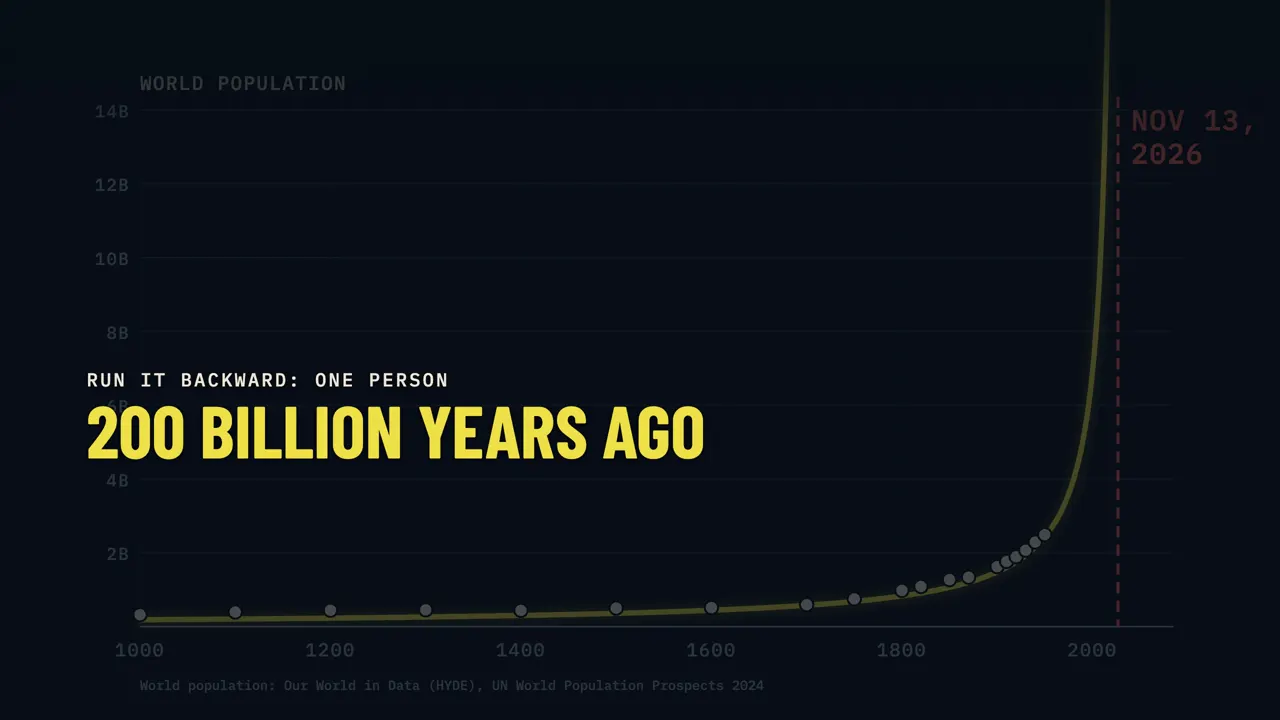
But the conclusion is serious. Our great-great-grandchildren, they wrote, won't starve to death. "They will be squeezed to death." Their proposed fix is pure cybernetics: a control system they called a peoplo-stat, a thermostat for the human population.
To hold the population steady, they said, the average family would have to have just a little more than two children. Remember that number. It comes back.
The letters page fights back

The paper came out on November 4, 1960, and the reaction was quick. The New York Times covered it the same day. In December, Walt Kelly's comic strip Pogo ran three strips about it. And the letters page of Science filled up.
Three scientists at Brookhaven National Laboratory argued that because a pregnancy lasts about 270 days, the population can't double faster than about every nine months. By their math, the curve would hit that limit and break about a year before doomsday, at around 167 billion people. They called that a ray of hope.
The mathematician Marvin Shinbrot was less amused. He called the conclusion "manifestly absurd", and pointed out that people come in whole numbers, so a model built generation by generation never reaches infinity. The most serious objection came from Ansley Coale, a demographer at Princeton.
Most demographers, he wrote, had taken the paper as a joke. Then he made a real argument. Growth had sped up, he argued, because fewer people were dying, not because people were having more children. And in every highly industrialized country, birth rates had come down.

The authors answered all of them. They named Shinbrot's objection "Shinbrot's last theorem", and they printed a Goya etching in Science, with the title translated as "Of what will they die?" To Coale, they said that pushing industrialization to lower birth rates would be like trying to put out a fire with gasoline.
They also made a deeper point. In physics, they wrote, a singularity, like the sound barrier or the voltage where a gas breaks down and conducts, isn't a promise that something becomes infinite. It's a welcome warning that the system is about to break down.
Doomsday wasn't the day everyone dies. It was the date by which something had to give. In 1962, they went after the United Nations. Within a decade, the UN's forecast for the year 2000 had climbed from 3.2 billion
people to 6.2 billion, and the authors mocked it for nearly doubling its estimate. Their own formula said 6.9 billion. The real number in 2000 turned out to be about 6.2 billion. The forecast they mocked was the one that came closest.
Ahead of schedule

But there's something the critics couldn't know yet. Lay the formula over today's best population estimates, and for decades the real world sits above the curve, not below it. In 1960, there were already about 200 million more people than the formula expected. The gap kept growing, and by 1976 it reached about 450 million.
In 1975, the mathematician James Serrin wrote a playful letter to Science asking whether doomsday was on target. He put the formula at 3.65 billion people, against a Population Reference Bureau estimate of 3.97 billion. Doomsday, he concluded, was running comfortably ahead of schedule. Serrin added a personal note: he'd turn 100 on November 1, 2026, and he'd rather the year didn't change.
He died in 2012, fourteen years short of it. In 1987, Stuart Umpleby, who had studied with von Foerster, sent Science another letter, titled "World Population: Still Ahead of Schedule." By his count, the world in 1980 had about 445 million more people than the formula predicted. Then the lines met.

Sometime in the second half of 1993, the real population finally slipped below the curve. After that, the formula raced away while the real world kept growing at a calmer pace. By 2000, the formula wanted about seven billion people. By 2020, about 29 billion.
And for July 2026, it calls for about 479 billion.
The real turn came in 1963
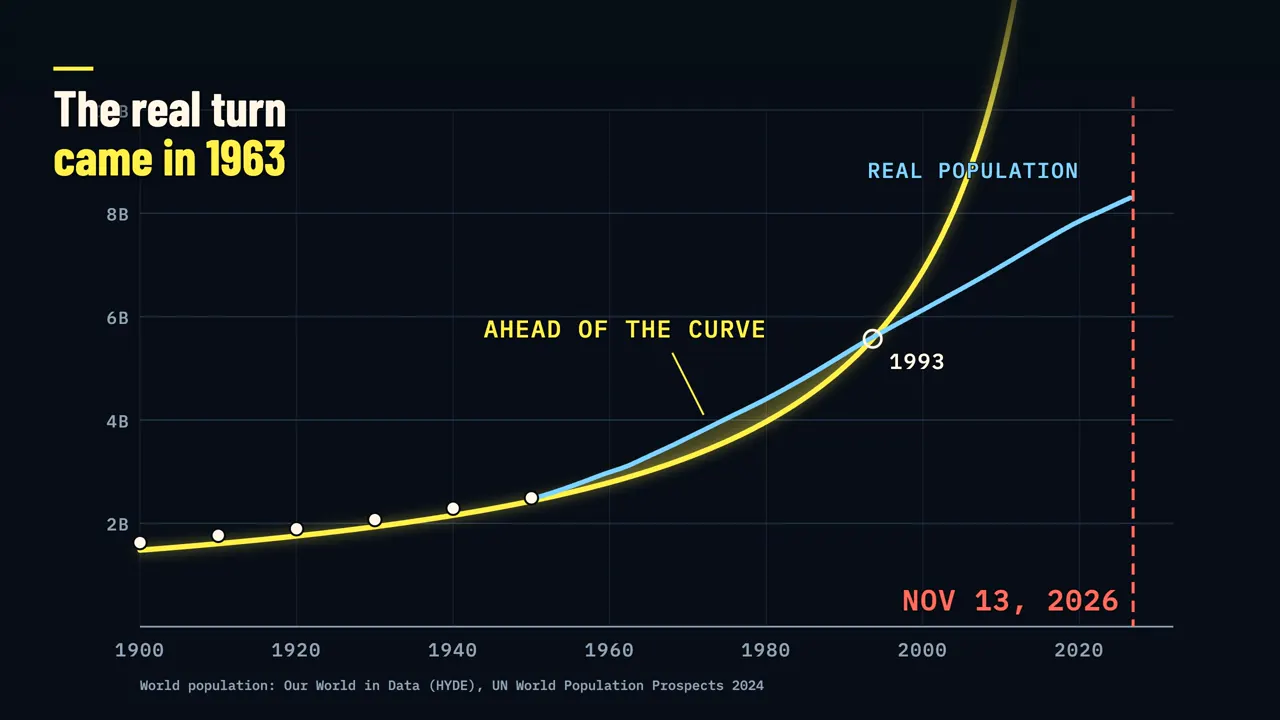
So if the population stayed ahead until 1993, when did things really turn? The answer is in the growth rate, not the head count. The formula needs the growth rate to keep climbing forever. In the real world, the global growth rate peaked in 1963, at about 2.3 percent a year.
That's three years after the paper came out. Since then it has mostly fallen, and today it's under 1 percent. After that, the other peaks came one by one, decades apart. The number of people added each year peaked in 1990, at about 94 million, because the population being added to was so much bigger.
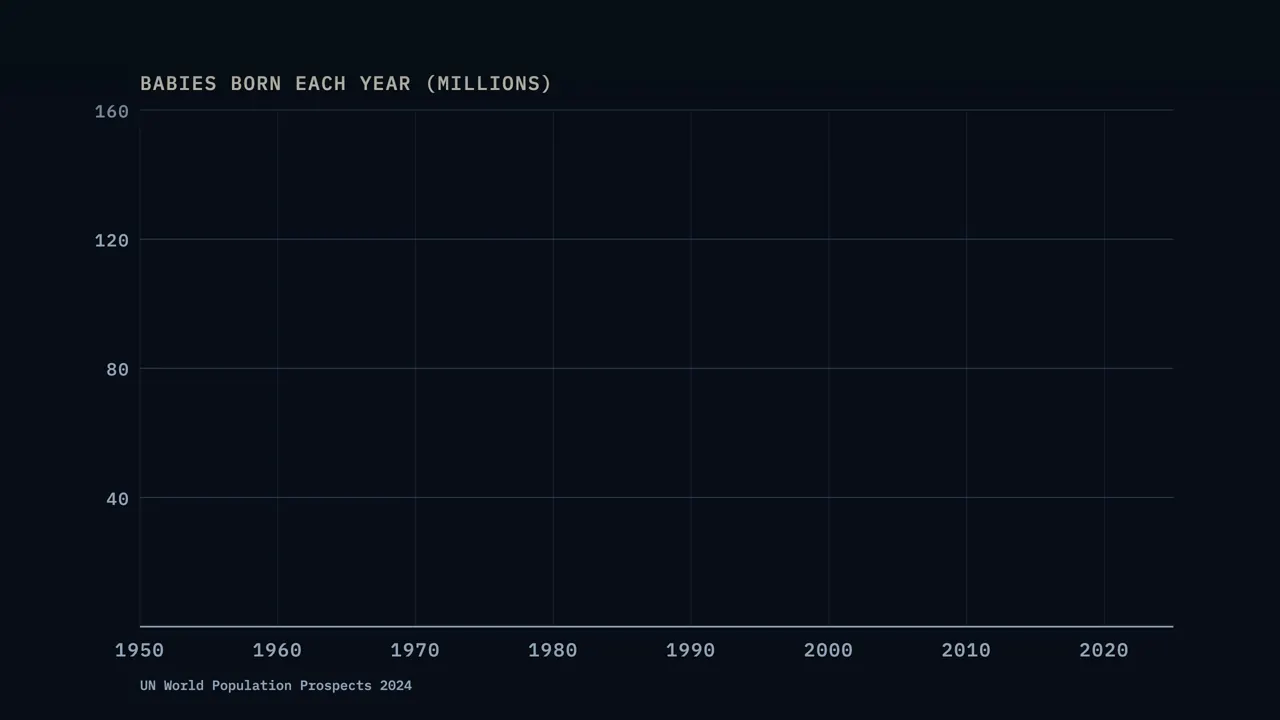
The number of babies born each year peaked around 2012, by the UN's count. The number of children under 15 peaked around 2020. And the population itself? The UN expects it to peak in the mid-2080s, at about 10.3 billion.
Part of that delay has a name: population momentum. Even when families get smaller, so many young people are already alive that the number of parents keeps growing for decades. The UN estimates that about 79 percent of the growth expected between 2024 and 2054 comes from that momentum.
Fewer deaths, then fewer births
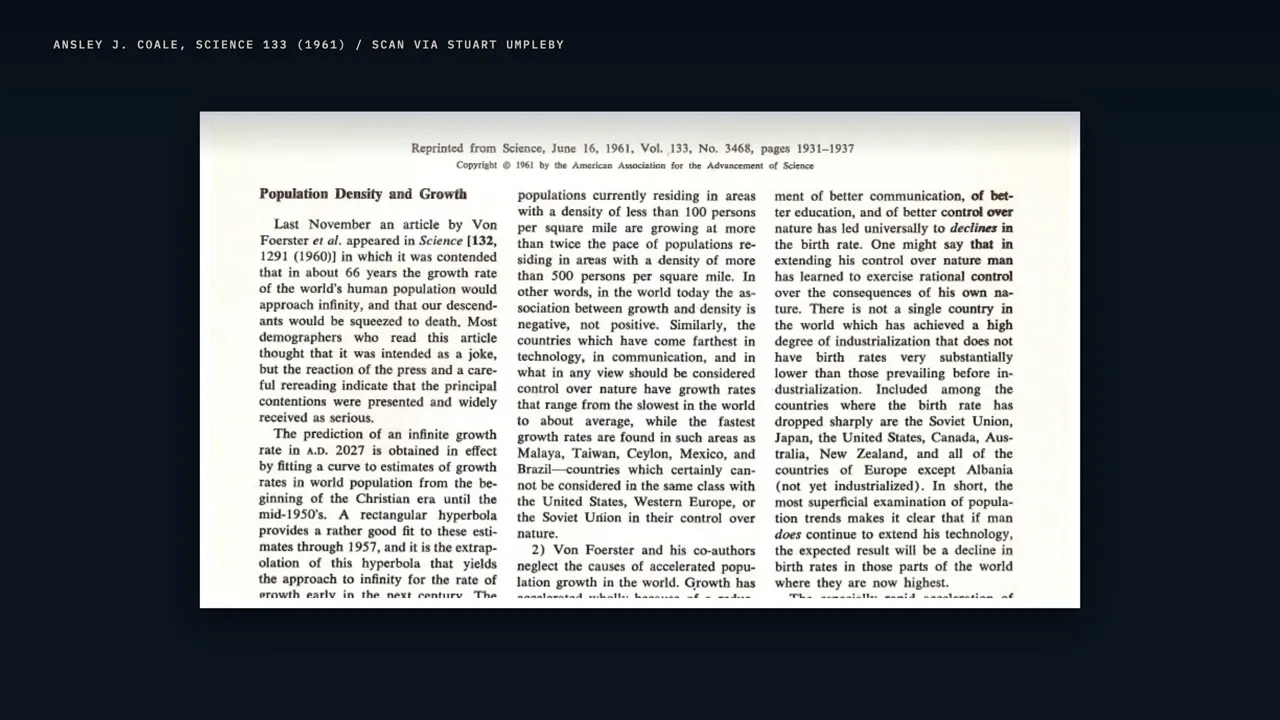
So what bent the growth rate? Coale's answer from 1961 turned out to be right. First, far fewer children died. In 1950, about 227 of every thousand children in the world died before their fifth birthday.
By 2024, it was about 36. Then, usually after a lag, births fell. The average number of births per woman worldwide went from almost five in 1950 to about 2.25 in 2024. Demographers call this the demographic transition, and it has played out on every continent, at different speeds.

In Bangladesh, women averaged almost seven children in 1975, and today it's just over two. In Iran, the average fell from about six and a half in 1980 to about two by 2000. In Brazil, economists linked the spread of the TV network Globo to lower fertility, and most of the leading female characters in its soap operas had no children at all.
In the Matlab area of Bangladesh, villages in a family planning program that began in 1977 had lower fertility than comparison villages for nearly two decades. And girls who stay in school longer tend to marry and have children later. None of this needed a peoplo-stat.
The fear years
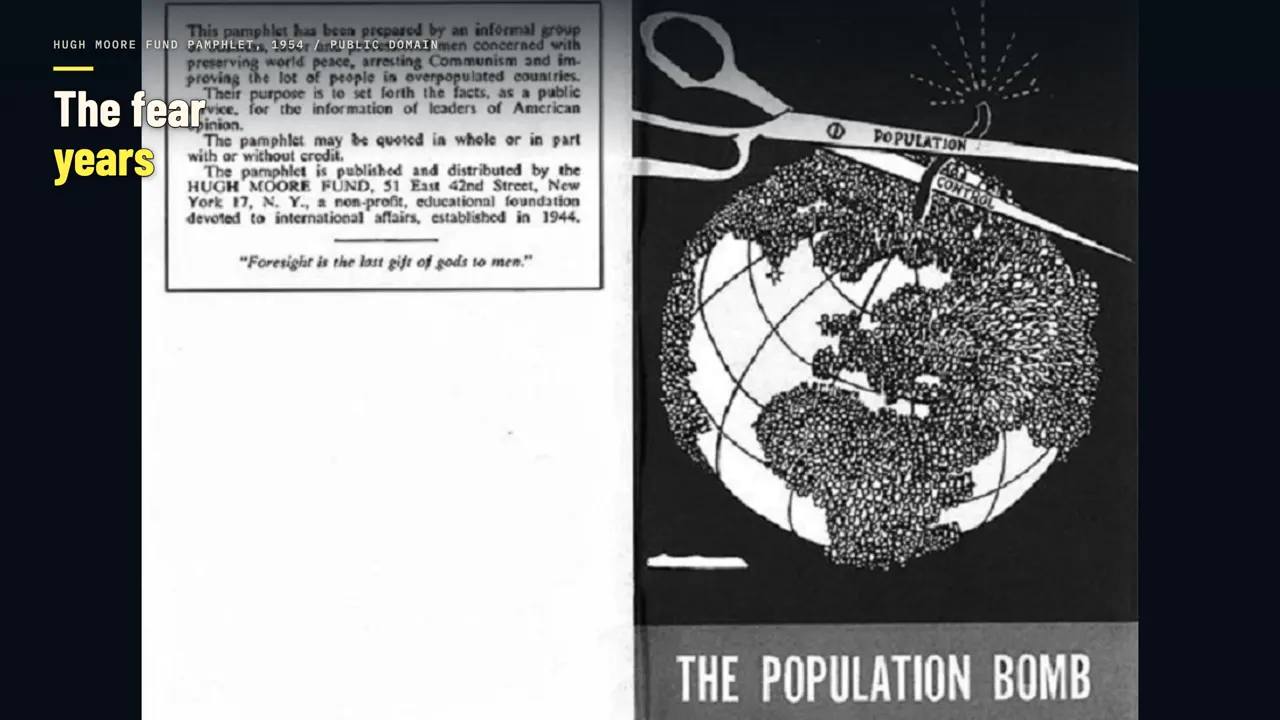
But in the 1960s and 70s, population growth still set off dire warnings. In 1968, the biologist Paul Ehrlich's book The Population Bomb opened by declaring that the battle to feed all of humanity was over, and warned of mass starvation within a few decades. In 1972, The Limits to Growth used a computer model to explore what could happen if growth continued on a finite planet.
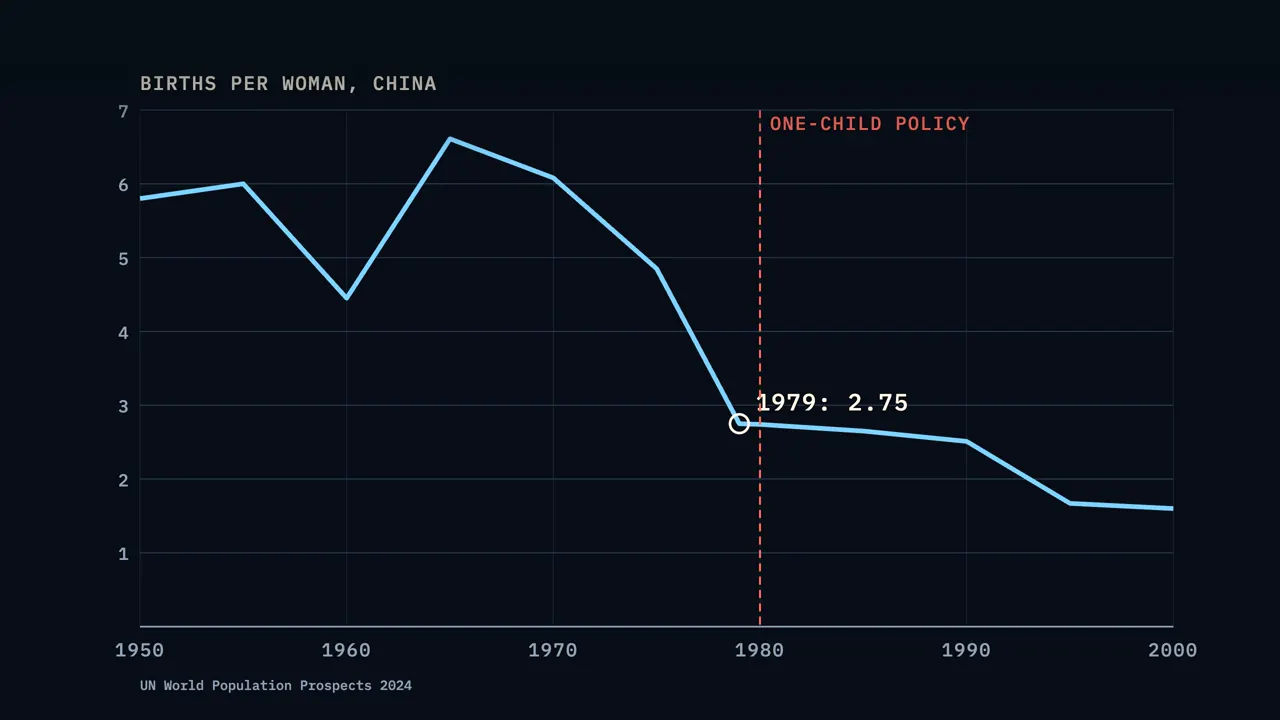
Some governments acted on the fear in ways that hurt people. During India's Emergency, from 1975 to 1977, millions of sterilizations were carried out, many of them, according to historical accounts, under pressure or by force. Around 1980, China introduced its one-child policy.
But look at the numbers. China's fertility had already fallen from about six children per woman in 1970 to under three by 1979, before the policy began. Meanwhile, wheat harvests in India and Pakistan jumped in the late 1960s with new high-yield varieties, work that won the plant breeder Norman Borlaug the 1970 Nobel Peace Prize.
In 1980, Ehrlich bet the economist Julian Simon that a basket of five metals would get more expensive over the next ten years, after inflation, as a sign of scarcity. Ten years later the basket was cheaper, and Ehrlich paid up. A later analysis found that over many other ten-year stretches, Ehrlich would have won.
Which decade you pick can decide who looks right, and the same goes for a curve fitted to two thousand years of guesses.
Birth rates today: the prescription came true
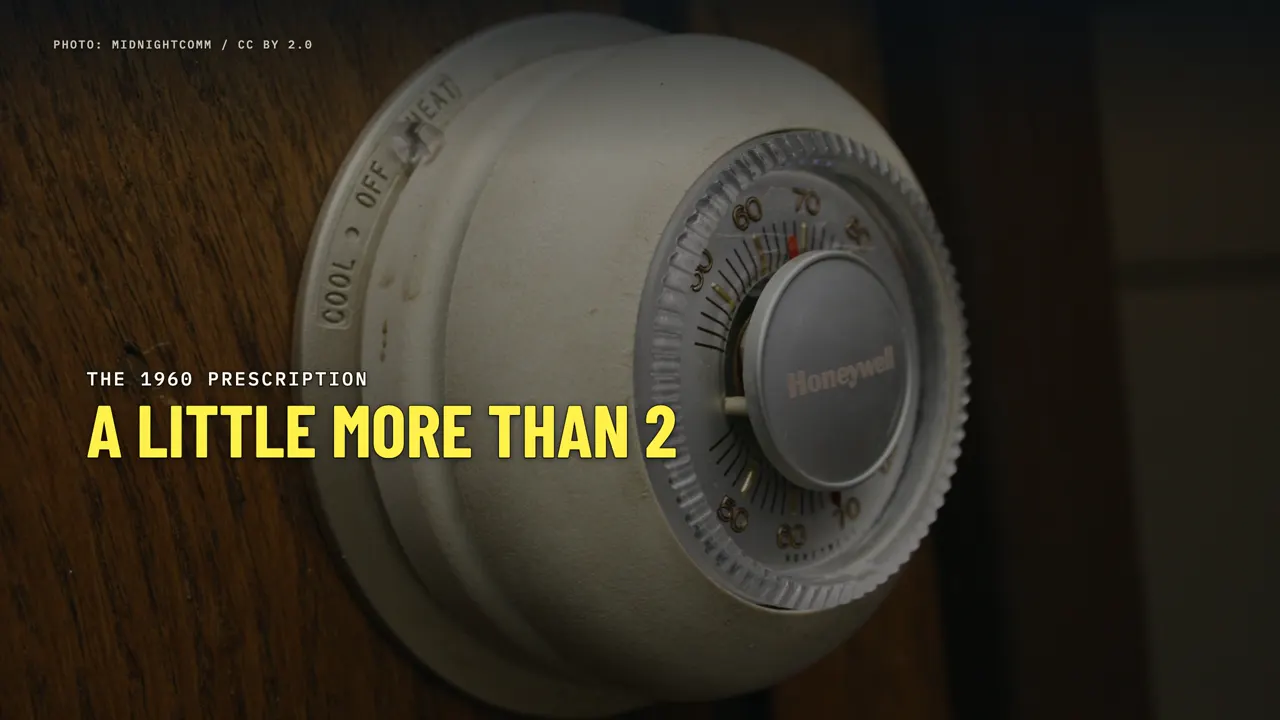
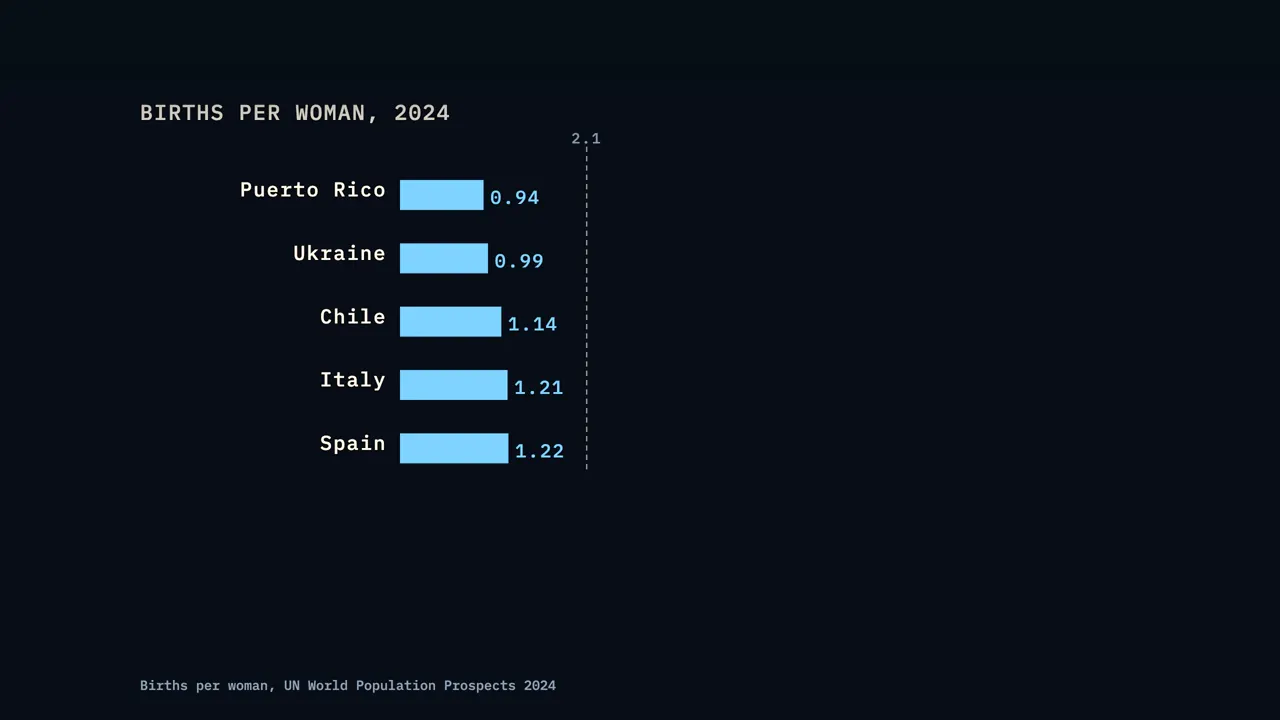
Remember the peoplo-stat? The authors said the average family needed just a little more than two children. In 2024, the world average was about 2.25 births per woman. That year, about two thirds of humanity lived in countries below 2.1, roughly the level that replaces each generation where few children die.
In 1960, that share was about 4 percent. It jumped in steps, when China fell below that line around 1991 and India around 2020. Very low fertility now spans East Asia, Europe, Latin America and the Caribbean. In the UN's 2024 figures, Puerto Rico was around 0.9, Ukraine under 1, Chile about 1.1, and Italy and Spain about 1.2.
In South Korea, women averaged about six children in 1960. In 2025 the figure was 0.80, one of the lowest anywhere, even after rising two years in a row. At the other end, Chad and Niger were still around six. By 2024, according to the UN, 63 countries and territories, home to about 28 percent of the world's people, had already passed their population peak.
And the worry has flipped. In 1968, the fear was a population bomb. Today, in many low-birth-rate countries, the warnings are about population decline and shrinking workforces. Both fears are about the same curve, seen from opposite sides.
Where the singularity went: economics and AI
So was the whole idea wrong? Not quite. Over the long run, the estimates do show growth speeding up as the population grew, which fits both the coalition idea and Kremer's model. What changed is that people began choosing smaller families just as the loop was running fastest.
In 1996, the Russian physicist Sergei Kapitza rewrote the formula with one extra ingredient, a time scale of about 42 years. With it, the curve doesn't hit infinity. It bends, and in the very long run it levels off at about 14 billion. In 2020, the economist David Roodman fitted a related growth model to estimates of the world economy going back to ten thousand BC.
His model's median date for an economic explosion was 2047. He knew a literal infinity is impossible, but he argued the result shouldn't be brushed aside. Like von Foerster, he read it as a sign that the system is unstable. A related loop now comes up in arguments about artificial intelligence.

In Kremer's version, the loop runs through people: more people, more ideas, more people. Falling birth rates cut that loop. Researchers including Tom Davidson have asked whether AI that can do research could close it again, without needing more people. Nobody knows yet.
But it's the same question the paper raised in 1960: what happens to a system that grows faster the bigger it gets?
What happens on November 13?

So what happens on Friday, November 13? Almost certainly, nothing. For July 2026, the UN projects about 8.3 billion people, not the 479 billion the formula asks for. Its error bar of five and a half years can't rescue it, because the real population left the curve back in 1993.
But the real lesson is in a line from their 1961 reply. The three billion people alive then, they wrote, would each soon have to decide. Have no more than two children and stay mortal, or reach for immortality and stay childless forever. Sixty-five years later, much of humanity lives at or below the level they prescribed, without any formula telling it to.
The curve didn't predict the end of the world. It measured how fast we were changing, right up to the moment we started to change course.
Watch on YouTube
Sources
- H. von Foerster, P. M. Mora and L. W. Amiot, "Doomsday: Friday, 13 November, A.D. 2026", Science 132:1291-1295 (1960): https://doi.org/10.1126/science.132.3436.1291
- Letters and replies in Science 133 (1961), 136:173 (1962), 189:86 (1975), 237:1555 (1987); scans collected by Stuart Umpleby: https://blogs.gwu.edu/umpleby/papers-on-world-population
- M. Kremer, "Population Growth and Technological Change: One Million B.C. to 1990", Quarterly Journal of Economics 108:681-716 (1993)
- S. P. Kapitza, Physics-Uspekhi 39:57-71 (1996): https://ufn.ru/en/articles/1996/1/c/
- D. Roodman, "Modeling the Human Trajectory", Open Philanthropy (2020)
- T. Davidson, "Could Advanced AI Drive Explosive Economic Growth?", Open Philanthropy (2021)
- United Nations, World Population Prospects 2024 (data and Summary of Results): https://population.un.org/wpp/
- Our World in Data, long-run population (HYDE): https://ourworldindata.org/grapher/population
- Statistics Korea via e-나라지표, total fertility rate: https://www.index.go.kr/unify/idx-info.do?idxCd=1011
- E. La Ferrara, A. Chong and S. Duryea, "Soap Operas and Fertility: Evidence from Brazil", AEJ: Applied 4(4) (2012)
- S. Joshi and T. P. Schultz, Matlab family planning program, Demography (2013)
- P. R. Ehrlich, The Population Bomb (1968); D. H. Meadows et al., The Limits to Growth (1972)
- M. K. Whyte, W. Feng and Y. Cai, "Challenging Myths About China's One-Child Policy", The China Journal 74 (2015)
- K. Kiel, V. Matheson and K. Golembiewski, "Luck or skill? An examination of the Ehrlich-Simon bet", Ecological Economics (2010)
Images and video
- Bacterial colonies / Photo: Alexander Klepnev / CC BY 4.0
- Drosophila / Photo: Sanjay Acharya / CC BY-SA 4.0
- Shibuya, Tokyo / Photo: Dick Thomas Johnson / CC BY 2.0
- Flinders Island / Photo: Graeme Bartlett / CC BY-SA 3.0
- Mumbai / Photo: Rakesh Krishna Kumar / CC BY-SA 2.0
- Photo: midnightcomm / CC BY 2.0
- Electric discharge / Photo: Oleh Lysak / CC BY 4.0
- Bangladesh / Photo: Ibrahim Husain Meraj / CC BY-SA 4.0
- Bangladesh / Photo: Sajidhasan2003 / CC BY-SA 4.0
- Indian family planning stamp, 1976 / India Post, GODL-India
- Abandoned school, Italy / Photo: IoSonoAndrea / CC BY-SA 4.0
- Sergei Kapitza, 2007 / Photo: Aleksandr Plyushchev / CC BY 2.0
- Hamka village, Niger (chapter "Birth rates today") / Photo: NigerTZai / CC BY-SA 4.0
- Other images and footage: public domain or CC0 (NASA, U.S. government, USAID, Prelinger Archives, The Met), Pexels, Mixkit and Coverr; Science letter scans via Stuart Umpleby; data from the UN and Statistics Korea.
- The narration is a synthetic voice. Images marked "Generated illustration" are generated, not records. Charts are drawn from the data sources listed above.